Turn data into decisions
OAC Analytics delivers this mission by focussing on 3 core objectives:
- To help businesses optimize their performance by transforming raw data into actionable intelligent analysis
- To aid understanding of data analysis by using advanced data visualisation methods
- To automate data processes to achieve analytic conclusions more rapidly
Bespoke solutions may draw on some or all of the above objectives.
For more details or a discussion of services we can offer please contact: richard.steele@oacplc.com
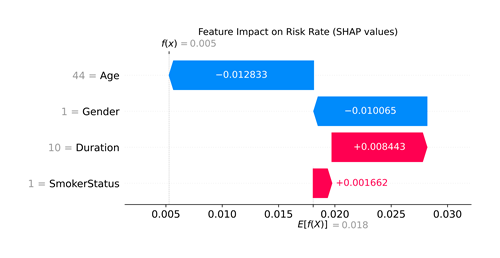
Objective 1: To help businesses optimize their performance by transforming raw data into actionable intelligent analysis
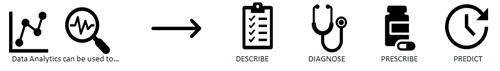
Data Analytics is the analysis of data within a systematic framework, utilising technological solutions and allowing trends and patterns to be identified.
Examples of areas covered:
- Machine Learning Data Analysis
- Lapse Analysis
- Mortality Analysis
- Data Quality review
- Data Analysis Reports
- Actuarial calculations
OAC Analytics can use the above methods to produce analytic reports with recommendations.
We can help to:
- Identify features of insurance business which explain or contribute towards lapse and surrender rates
- Compare the fit of existing mortality models against alternative options using additional data features
- Conduct segmentation analysis of customers to help understand behaviours

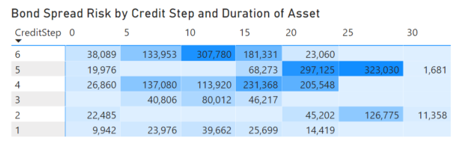
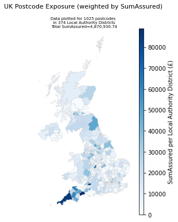
Objective 2: To aid understanding of data analysis by using advanced data visualisation methods
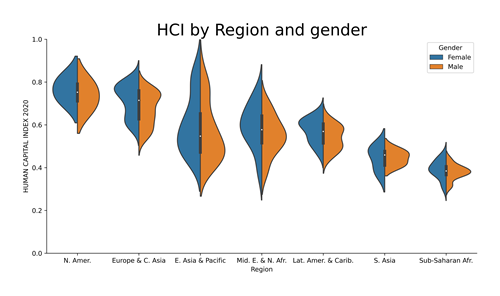
Data visualisations bring data analysis to life and allow conclusions to be told in the form of data stories.
We can help to:
- conduct exploratory data analysis for any data-file summarised as a report packed with key findings in the form of visualisations
- build specific visualisations/reports/dashboards to summarise data to key stakeholders
- design and build analytic dashboards for a variety of business purposes:
- Data File Summaries
- Business Critical Information
- Actuarial Model Outputs
- Market/Industry Information
- Calculation Engines
 |
 |
 |
 |
 |
 |
 |
 |
OAC Analytics utilises visualisation software to present these stories to bring data to life.
For a discussion of the available options or a demonstration please contact: richard.steele@oacplc.com
To read a case study: Data Visualisation (Census Dashboard)
Objective 3: To automate data processes to achieve analytic conclusions more rapidly
- Review of manual data processes
- Conversion of manual data processes
- Automated Data formatting /model integration
We can help to:
- Scrape and format publicly available information ready to be used within data processes
- Replace process-critical spreadsheets with automated process components
- Produce automated data checks and exception reports
- Produce automated model outputs, visualisations and reports
Why not discuss your current data bottlenecks and OAC Analytics will propose improvements to streamline your processes?
For a discussion of the available options or a demonstration please contact:richard.steele@oac.co.uk
To read a case study: Process optimisation Case Study